Ballistic charts have moved from the pages of specialty magazines into the daily toolkit of hunters, competition shooters, and tactical operators alike. By translating complex physics into simple, printable tables, they let users gauge bullet drop, wind drift, and energy retention at a glance—information that can mean the difference between a clean hit and a missed opportunity. This article breaks down the practical benefits, the trade‑offs, and the realistic expectations you should set before relying on a chart for your next outing.
Why Ballistic Charts Matter in Real‑World Shooting
At their core, ballistic charts are distilled calculations of a projectile’s behavior from muzzle to impact. For a busy shooter, the main advantage is speed: instead of pulling up a phone app or running a full trajectory program, you can reference a printed sheet or a quick spreadsheet and make adjustments on the fly. In the field, that translates to faster holdovers, more accurate wind calls, and a clearer picture of how far your chosen load will stay effective.
Key Benefits You’ll Actually Use
Instant Holdover Guidance
- Speed over computation. A single glance tells you how many inches to aim high at 300 yards, cutting the time spent fiddling with calculators.
- Consistent reference point. Because the chart is static, you avoid discrepancies that sometimes appear between different software versions.
Wind‑Drift Estimation Without Guesswork
- Quantified drift. Charts typically list drift in inches for common wind speeds (5 mph, 10 mph, etc.), letting you add a precise correction rather than estimating.
- Scenario planning. By reviewing a range of wind values before you head out, you can decide which load offers the most forgiving drift profile for the day’s conditions.
Energy Retention Insight
- Terminal performance. Knowing the kinetic energy remaining at 500 yards helps you choose a bullet that will still expand reliably on game or a target.
- Legal compliance. Some jurisdictions impose minimum energy thresholds for hunting; charts let you verify compliance ahead of time.
The Trade‑offs You Can’t Ignore
Assumptions Built Into Every Table
Most charts assume a standard atmosphere—sea level, 59 °F, 78 % humidity. Deviations in altitude, temperature, or barometric pressure will shift bullet drop and drift, sometimes enough to miss a vital point‑blank shot. If you routinely shoot in high‑elevation areas or extreme weather, a chart alone may be insufficient.
Limited Load Flexibility
Charts are usually generated for a single bullet weight, shape, and muzzle velocity. Changing powder charge, switching to a different bullet design, or even swapping manufacturers can invalidate the numbers. Maintaining a library of charts for each load you use adds paperwork and the risk of pulling the wrong sheet.
Static Data vs. Dynamic Environments
Real‑time variables—like sudden gusts or unexpected temperature shifts—require on‑the‑spot adjustments that no static chart can anticipate. Relying exclusively on printed numbers can foster overconfidence and reduce the habit of observing actual conditions.
Setting Realistic Expectations
Ballistic charts are best thought of as a solid baseline, not a crystal ball. For most recreational shooters, they provide enough accuracy to place a tight grouping within a few inches of the intended point at typical engagement ranges (up to 600 yards for many .30‑caliber rounds). However, for long‑range precision competitions where sub‑MOA performance is required, shooters often supplement charts with live‑range verification and digital tools that factor in real‑time atmospheric data.
In practice, the most reliable workflow looks like this: generate a chart for your primary load, print it in a durable, weather‑proof format, and then cross‑check a few key distances on the range before heading out. If your field conditions differ markedly from the chart’s assumptions, adjust the holdover by a small percentage (5‑10 %) rather than discarding the entire reference.
Practical Steps to Integrate Charts Into Your Routine
- Pick a consistent load. Stick to one bullet weight and powder charge for each chart you create.
- Use reputable software. Programs like Hornady’s Ballistics Calculator or JBM Ballistics let you export tables in CSV format for easy printing.
- Laminate or protect the sheet. Field conditions can be harsh; a water‑resistant cover ensures the numbers stay legible.
- Test before you trust. Fire a three‑shot group at 100, 300, and 500 yards; compare the actual impact points to the chart’s predictions and note any systematic offsets.
- Update annually. New bullet designs or changes in your rifle’s barrel condition (e.g., fouling buildup) can shift performance, so refresh your charts each season.
Bottom Line
When used wisely, ballistic charts give busy shooters a quick, reliable reference that bridges the gap between raw physics and practical marksmanship. They excel at delivering immediate holdover and wind‑drift data, streamline decision‑making, and help ensure legal and ethical shooting practices. The downside is their reliance on static assumptions and the need for diligent maintenance. By pairing charts with occasional live verification and staying aware of environmental factors, you can maximize your firearm’s potential without falling into the trap of over‑reliance.
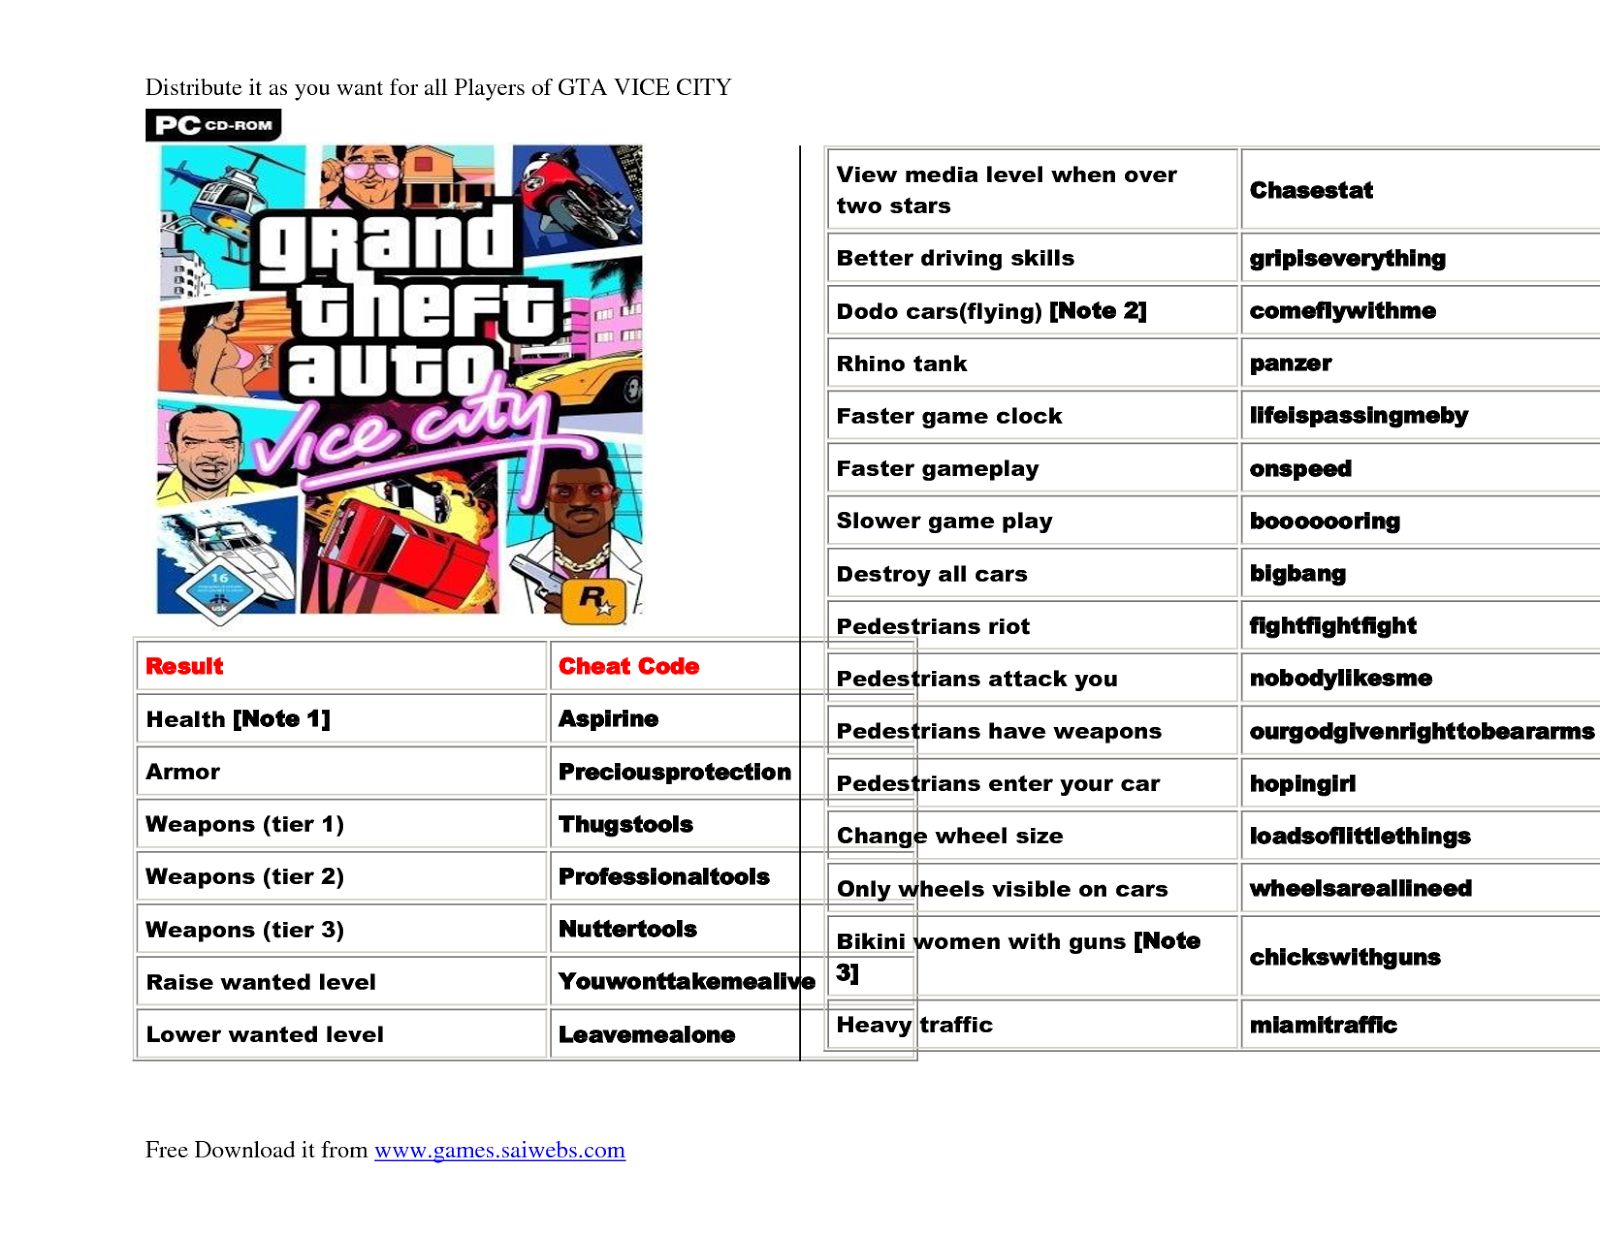
GTA Vice City PC Cheats And Codes | Motor Vehicle | Car

GTA Vice City PC Cheats and Codes | Motor Vehicle | Car
Gta Vice City Car Cheats

Gta Vice City Car Cheats
Gta Vice City Cheats Android Keyboard Download At Ruby Gooding Blog
Gta Vice City Cheats Android Keyboard Download at Ruby Gooding blog
GTA Vice City PC Cheats | PDF

GTA Vice City PC Cheats | PDF
Gta Vice City Cheat Codes Switch At Henry Lymburner Blog

Gta Vice City Cheat Codes Switch at Henry Lymburner blog